Extracts
from
A Measurement of the Magnetic Earth-Ionosphere Cavity
Resonances in the 3-30 Hz. Range
John F. Sutton
Code 728
Goddard Space Flight Center, NASA
Greenbelt, Maryland 20771
and
Craig Spaniol
Chairman, Dept. of Industrial Technology
West Virginia State College
Institute, West Virginia 25112
. . . During June and July 1988, the authors made measurements of the
magnetic field component of the earth-ionosphere cavity resonances using
a ferrite-cored solenoid search coil. The apparatus consisted of
the search coil, low noise amplifiers, and a Hewlett-Packard model 3582A
Fast Fourier Transform spectrum analyzer. The search coil and
preamplifier combination are capable of detecting sinusoidal magnetic
signals as small as 1 pico Tesla rms. The amplifier employed is an
experimental device based on the Precision Monolithics OP-27 bipolar
operational amplifier. It consists of a feedback circuit with a
flat frequency response with magnetic field strength, i.e., the
amplifier gain has a 6 dB/octave low pass filter response which exactly
compensates for the 6 dB/octave high pass characteristic of the search
coil. The OP-27 noise specifications are: 3.5nV/Root Hz voltage
noise and 1.7pA/root Hz current noise density. It was found
experimentally that the noise of the sensing circuitry was substantially
below the environmental magnetic field noise. This means that
little can be done to obtain better isolation of the cavity resonance
signals through further reduction of amplifier noise. Improvements
will have to be made through careful selection of measurement sites far
from sources of man-made interference. . . .
. . . June is the time of minimum cavity resonance activity, so
considerable time was spent observing and waiting for activity of
sufficient intensity and sufficient duration such that meaningful
measurements could be made. Often a peak or peaks would appear and
disappear before an analysis could be made. It was found that the
maximum activity occurred during the early morning hours, corresponding
to peak thunderstorm activity "twelve hours away" on the side
of the earth opposite the measurement site in Maryland. The site
chosen was a location at the bottom of a 12 foot deep gully
approximately 100 yards from the nearest electric power wiring.
After several attempts at data collection, spectra of the 8, 19, 25, 36,
and 42 Hz. resonances were obtained. . . .


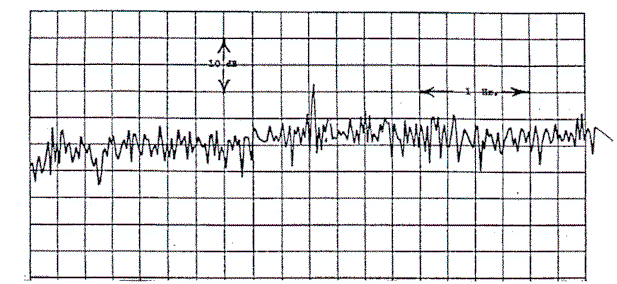
Figure 9. Cavity Resonance Response at 19.04 Hz.
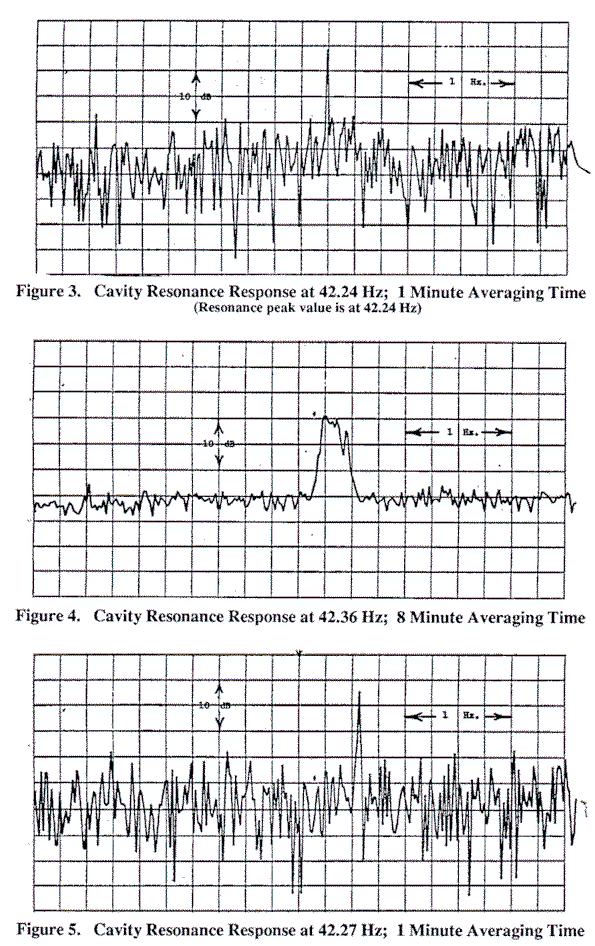
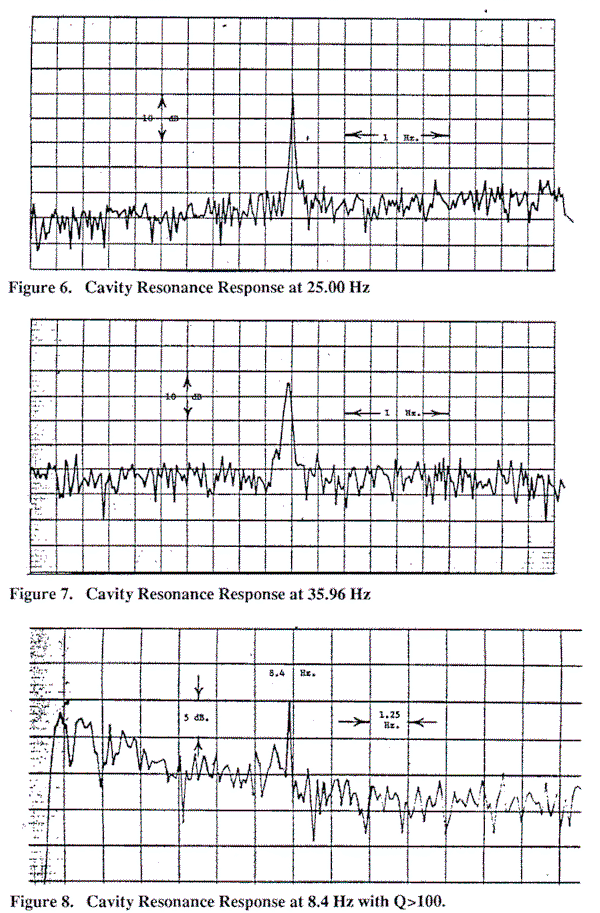
The resulting measurements are given as obtained from the analyzer in Figures 3-9. The Q values measured are of the order of 100-2000, limited by the resolution of the analyzer. These values are at variance with the values, typically of order 8, reported in the literature [2]. To explain this apparent discrepancy, we note that the resolution of the analyzing equipment reported in the literature, as discussed before, is of the order of 8, so it is not surprising that the analyses would be limited to these low values. Also, it should be noted that the cavity resonance frequencies vary with time, a period of the order of several minutes between changes in frequency being common. Thus, any measurement which involves averaging over a period of the order of ten minutes might produce data which appears to indicate a Q much lower than what would be calculated if a shorter averaging time were used. This phenomenon is illustrated by Figures 3 and 4. In Figure 3, made with an approximately 1 minute averaging time, a calculated Q of at least 1,000 is obtained, while the ten minute averaging time of Figure 4, during which time the cavity resonance changed in frequency, yields a calculated Q value of only approximately 200 due to the "smearing out" effect caused by the change of frequency. Figure 5 is a plot of a one minute averaging time analysis of the cavity resonance after it had once again become stable at a new frequency. This behavior is analogous to observing the output of a precision laboratory sinusoidal function generator while someone occasionally slightly readjusts the frequency dial setting. Figures 6 and 7 are plots of resonances at 25.00 Hz and 35.96 Hz, respectively, both with Q's of approximately 600. Figure 8 is a plot of an 8.4 Hz. cavity resonance response with a Q of at least 100. Figure 9 is a cavity response at 19 Hz just resolved above the noise level. It has a Q of at least 1,000. . . .
References
[1] Nikola Tesla Colorado Springs Notes, Beograd, Yugoslavia:
Nolit, 1978.
[2] J.F. Corurn, K.L. Corum, C. Spaniol, "Concerning Cavity Q," Proceedings of the
1988 International Tesla Symposium, Colorado Springs: International Tesla Society,
1988.
[3] H.W. Secor, "America's Greatest War Invention, The Rodgers Underground
Wireless," Electrical Experimenter, March 1919.
[4] M.J. Rycroft. "Resonances of the Earth-Ionosphere Cavity Observed at Cambridge,
England," Radio Science, August 1965.
[5] Preliminary HP 35660A Operating Manual, Hewlett Packard Company, 1988.
[6] Linear and Conversion Products, 1986/1987 Data Book. Santa Clara, CA: Precision
Monolithics.